Written by Kobe Lannoo, Global lead swine
In the last 25 years various alternatives to antibiotics have been developed by the animal feed industry. Although snippets of information are available for comparing candidates, few studies have assessed the lead candidates using the same platform. An exception is the work of Neath, Portocarero, and Jones (2021). They determined the Minimum Inhibitory Concentration (MIC) for 34 compounds against 5 important swine pathogens using broth microdilution assays with interesting results.
Microbiology assay?
Test materials were first mixed into Mueller-Hinton II broth containing 0.4% polysorbate 80, an emulsifier. This starting material was used to make two-fold dilution series in 96-well plates. Subsequently, the test microbe was added to each well at a concentration of approximately 1.5*108 colony forming units with again the emulsifier in order to keep its concentration the same. Samples were subsequently incubated overnight. Following incubation bacteria were counted using colorimetric assays.
Microbes included in the test were (and abbreviations used):
- Staphylococcus aureus (Staph)
- Streptococcus suis (Strep)
- Actinobacillus pleuropneumoniae (previously called Haemophilus pleuropneuomiae) (Actino)
- Salmonella Typhimurium (Salmo)
- Escherichia coli (E. coli)
MIC values ranged from 0.49 to >31.25 mg/ml (31.25 mg/ml was the highest concentration tested).
It should be pointed out that pH was not controlled for in these incubations. pH ranged from 3.5 for formate to approximately 9 for butyrate; such extremes can affect microbial growth. As in vivo pH is very much managed by the host, such pH effects may not persist in the animal.
Emulsifiers?
The methodology used includes an emulsifier, polysorbate 80. The use of emulsifiers is actually quite common in this type of assay (e.g., Houf, Batovska, Kovanda). These emulsifiers are deemed necessary as the test molecules don’t all mix with water. E.g., the senior author of the Neath paper indicated that C12 could not be tested without an emulsifier as it would float on top of the incubation broth and thus not harm microbes. What this means, though, is that in vitro test procedures are used that do NOT per se mimic what is happening in the animal. Emulsifiers are sometimes being added to animal feed, but this is done to increase fat digestion, not to enhance the antimicrobial effects of feed additives. The animal itself also secretes bile acid in the small intestines, themselves very strong emulsifiers. Bile, however, is not normally present in the stomach where the test components may well have the lion share of their activity. As such, we need to be critical what the results for the poorly soluble molecules means in practice.
Test molecules
For the list of test compounds the acid/salt form has been ignored in order to simplify the table. For several products more than one form was included in the test but generalizing this did not greatly affect the results. Hence, average values are reported. The test molecules were (and abbreviations used):
Free/Medium-chain fatty acids:
- Butyrate (C4)
- Caproate or Hexanoate (C6)
- Caprylate or octanoate (C8)
- Capric or decanoate (C10)
- Laurate (C12)
- Blends of MCFA
Essential oils:
- Alpha pinene
- Beta pinine
- Eugenol
- Oregano oil
- Galangal oil
- Terpene
- Methoxybenzene
- Monoterpene
Monoglycerides:
- Monopropionate (mC3)
- Monobutyrate (mC4)
- Monovalerate (mC5)
- Monocaprylate (mC6)
- Monopelargonate or monononanoate (mC9)
- Monolaurate (mC12)
- Blend of monoglycerides
Others:
- Glycoside A
- Glycoside B
- Zinc oxide
- Benzoic acid
- Formic acid
Data presentation
In the original publication results are presented in MIC values in mg/ml: what is the lowest concentration at which the compound remains active, e.g., at 0.001 g/ml. This form of presentation is technically correct but visually challenging; in a graph it results in very small bars being the most interesting. As small bars easily hide in a busy picture, it was decided to invert the numbers. Thus, data are presented as ml/mg: what is the maximum dilution of a molecule at which it still inhibits microbial growth. Thus, 0.001 g/ml changes in 1000 ml/g; 1 gram of active can be diluted 1000 fold and at that point it still inhibits the growth of a microbe. A second advantage is that molecules that in the test failed to inhibit growth can be plotted as 0.
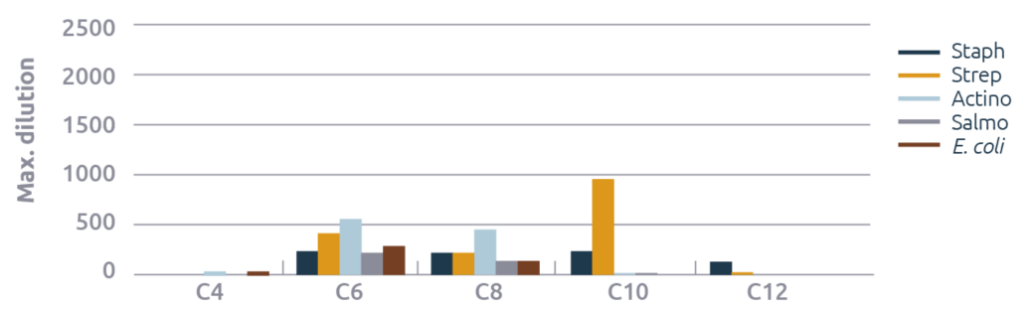
Fatty acids
A strong effect of fatty acid chain length was observed (figure 1). Both C6 and C8 had reasonable to good antimicrobial effects for all microbes tested, while C10 worked strongly against Strep. For C10 and C12 reasonable growth inhibition was also seen against Staph. The effects seen for C4 were at concentrations that make them practically irrelevant.
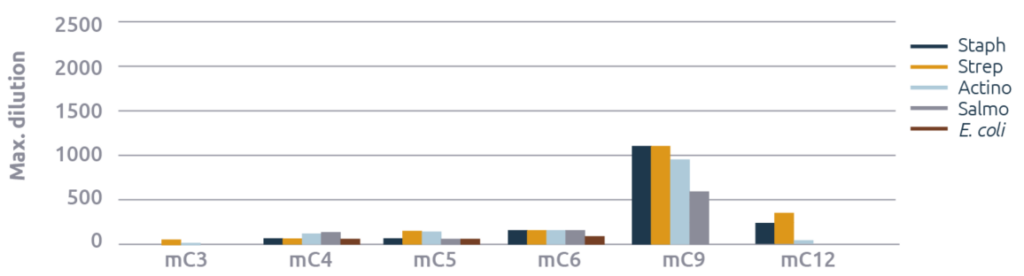
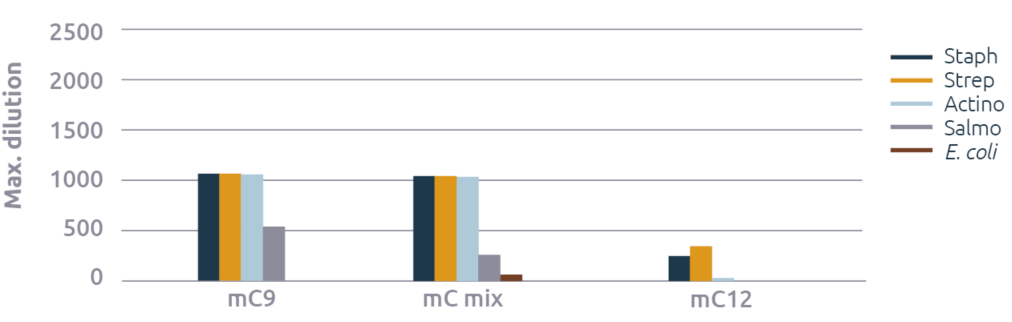
Monoglycerides
Also for monoglycerides a strong fatty acid chain length effect was observed (figure 2). MC9 had the strongest antimicrobial effect, except against E. coli against which mC5 and mC6 had weak efficacy. The results observed with mC12 are not in line with commercial claims made. Its activity is limited to Staph and Strep for which it scored reasonable.
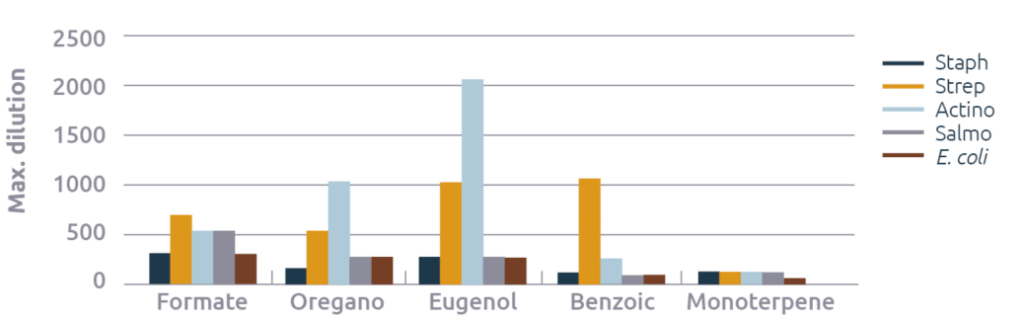
Essential oils and other compounds
Alpha and beta pinene, methoxybenzene, and Glycoside A and B failed to inhibit microbial growth. Zinc oxide only had a weak effect against Actino supporting the concept that zinc oxide is an immune modulator rather than antimicrobial compound. Galangal oil also weakly inhibited only Actino. Hence, their data are not shown. Formate, oregano, eugenol, benzoic acid, and monoterpene did show reasonable to excellent antimicrobial activities (figure 3). For formate, the above mentioned pH effect may well contribute to its strong antimicrobial effect, and a question is what effects the molecule has in digestive tract segments where the animal controls the pH.
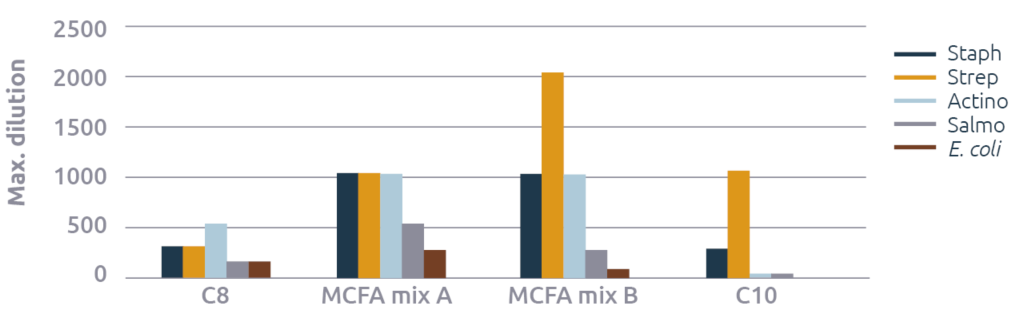
Proof for synergy
The test also included blends of MCFA and blends of monoglycerides (figure 4). These data show that blends of MCFA improved their antimicrobial effects as compared to the individual MCFA: MCFA mix A and B maximum dilution values that on average were 3 times stronger than C8 and C10! Thus, with optimized blends a much higher efficacy can be obtained than with individual MCFA.
For monoglycerides the proof for synergy is less convincing (figure 5). The exception is against E. coli, where the blend of monoglycerides is barely effective, while mC9 or mC12 had zero effect.
And the winner is…
Averaging the MIC values for the different microbes resulted in the following ranking of products:
1) MCFA blend A
2) Formate
3) Eugenol
4) C6
5) Oregano
6) MCFA blend B
This comparison again highlights the benefits of cocktails of MCFA for controlling potentially pathogenic bacteria relevant for swine production. It is a pity that cocktails of C6 and C8 were not tested; these data imply that such cocktails may well be the most effective.
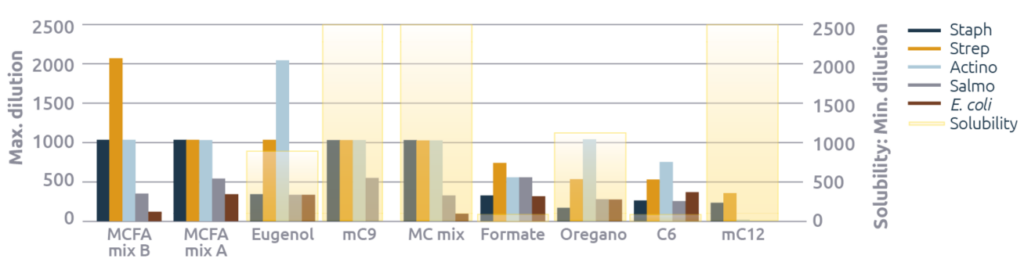
Above it was highlighted that an emulsifier was used in order to allow difficult-to-dissolve molecules to affect bacteria as otherwise they would simply float on top of the liquid in the incubation vessels. In the graph below solubility limits are shown for the various test molecules as red bars. These solubility data are shown as a minimum dilution factor: what is the minimum ratio of water to molecule in order to get it fully solubilized? E.g., formate has a solubility of 0.00139 g/ml, hence it has to be diluted at least 72 fold (1/0.00139). In figure 6 these minimum dilution factors have been included for the various test products. The bars for this are purposely fading towards the top; the data used to calculate the minimum dilution factors are for dissolving molecules in pure water. In the intestinal tract we have a much more complex environment and there are many factors present that influence the actual solubility of molecules. Hence, when we get close to the solubility limit in water, it is possible that the test molecules will already be fully soluble in e.g., the stomach environment (but the opposite may be true as well, that solubility is much poorer than in pure water). Thus, we should not see the water solubility as a sharp divider but as an indication.
Besides solubility, there is a second limiting factor; the maximum inclusion of the product in the feed. Additives are generally dosed at less than 1% in the feed. Feed consumed is typically diluted with drinking water in a ratio of roughly 2.5:1 and on top it is diluted by saliva and other liquids secreted in the digestive tract. Thus, a feed additive dosed at 1% or 10 g/kg feed will distribute in at least 2500 g of water, a dilution factor of 250. As water and feed intake are not necessarily perfectly synchronized (except with liquid feeding), we again should not see this factor 250 as rigid, but as an indication. Maximum dilution thresholds of less than 100, though, are unlikely to be of practical relevance.
The data imply that for MCFA mix B, solubility but also the inclusion rate in the feed will likely prevent it from being effective against E. coli, this as the red bar is higher (at 357) than the maximum dilution threshold for E. coli (64) but also as a maximum dilution rate 64 can’t be achieved with the normal inclusion in the feed. For the other four microbes solubility is not a limiting factor. From that perspective, MCFA mix A may actually do better in practice than MCFA mix B: its’ activity against E. coli is higher and close enough to the solubility threshold such that it may still work in practice, while it does an excellent job against Staph, Strep, and Actino, and a good job against Salmo.
Third in ranking was eugenol. Eugenol has a strong odor hurting stability, which makes it tricky to use in practice. Its solubility, on top, is borderline for three of the microbes evaluated. MonoC9 (monopelargate) and the monoglyceride blend technically scored 4th and 5th. Solubility data for monoC9 were not available in the consulted database (Pubchem, Sellekchem), but as monoC8 and monoC10 have a very poor solubility it is assumed that also monoC9 as well as the monoglyceride blend are poorly soluble. Thus, the obtained MIC data are quite theoretical and require verification in conditions mimicking the stomach, where typically emulsifiers are not present in high concentrations.
Formate came in sixth, and its effects are certainly not hampered by solubility. Formate, though, reduced the incubation broth to pH 3.5, and a question is which of its effects are a result of the formate molecule, and which of its effects are due to pH. In the animal, pH will be affected by the diet in which the additive plays a role, but very strongly by the animal, thus a big question is what will happen in the animal.
For oregano, key ingredients are carvacrol and thymol. Carvacrol has a very poor solubility and is often listed as insoluble. Thymol has a reasonable solubility and the solubility shown in figure 6 is therefore only for thymol, thus technically incorrect as that is not the product tested. Based on the solubility of thymol it would be expected that the antimicrobial properties of oregano in practice may well disappoint.
mC12 did not score in the top 10 but as it is heavily promoted as a better alternative to MCFA it is included in the graph for comparison. It required a 10 fold HIGHER concentration to be effective than C6 and C8 and a 20 fold higher concentration than the C8/C10 combination. It had effectively no efficacy against Salmo, E. coli and little activity against Actino. This picture becomes even worse when the solubility of mC12 is taken into consideration; its poor solubility prevents it from achieving the concentrations required to be antimicrobial. As such, any antimicrobial effect will only be seen when mC12 is emulsified, something that feed formulations are not routinely optimized for.
References are available upon request.