By Jan Vervloesem (Poultry Category Manager)
Although long-term projections are positive for the poultry meat industry, the actual situation (high feed prices, fluctuating meat prices, volatile export markets, and the transition to more sustainable and antibiotic-free production) is an existing challenge for producers. These circumstances are putting margins under pressure.
If the market conditions include increased feed prices that are not fully compensated by higher meat prices, not only will feed cost per kg rise but total profitability is reduced. When this economic environment occurs, a critical evaluation of the production process is needed to optimize the business. During the evaluation, understanding the feeding strategy and feed costs to lower the cost per kg is key; additional elements include sustainability, food safety, animal welfare, and consumer acceptance.
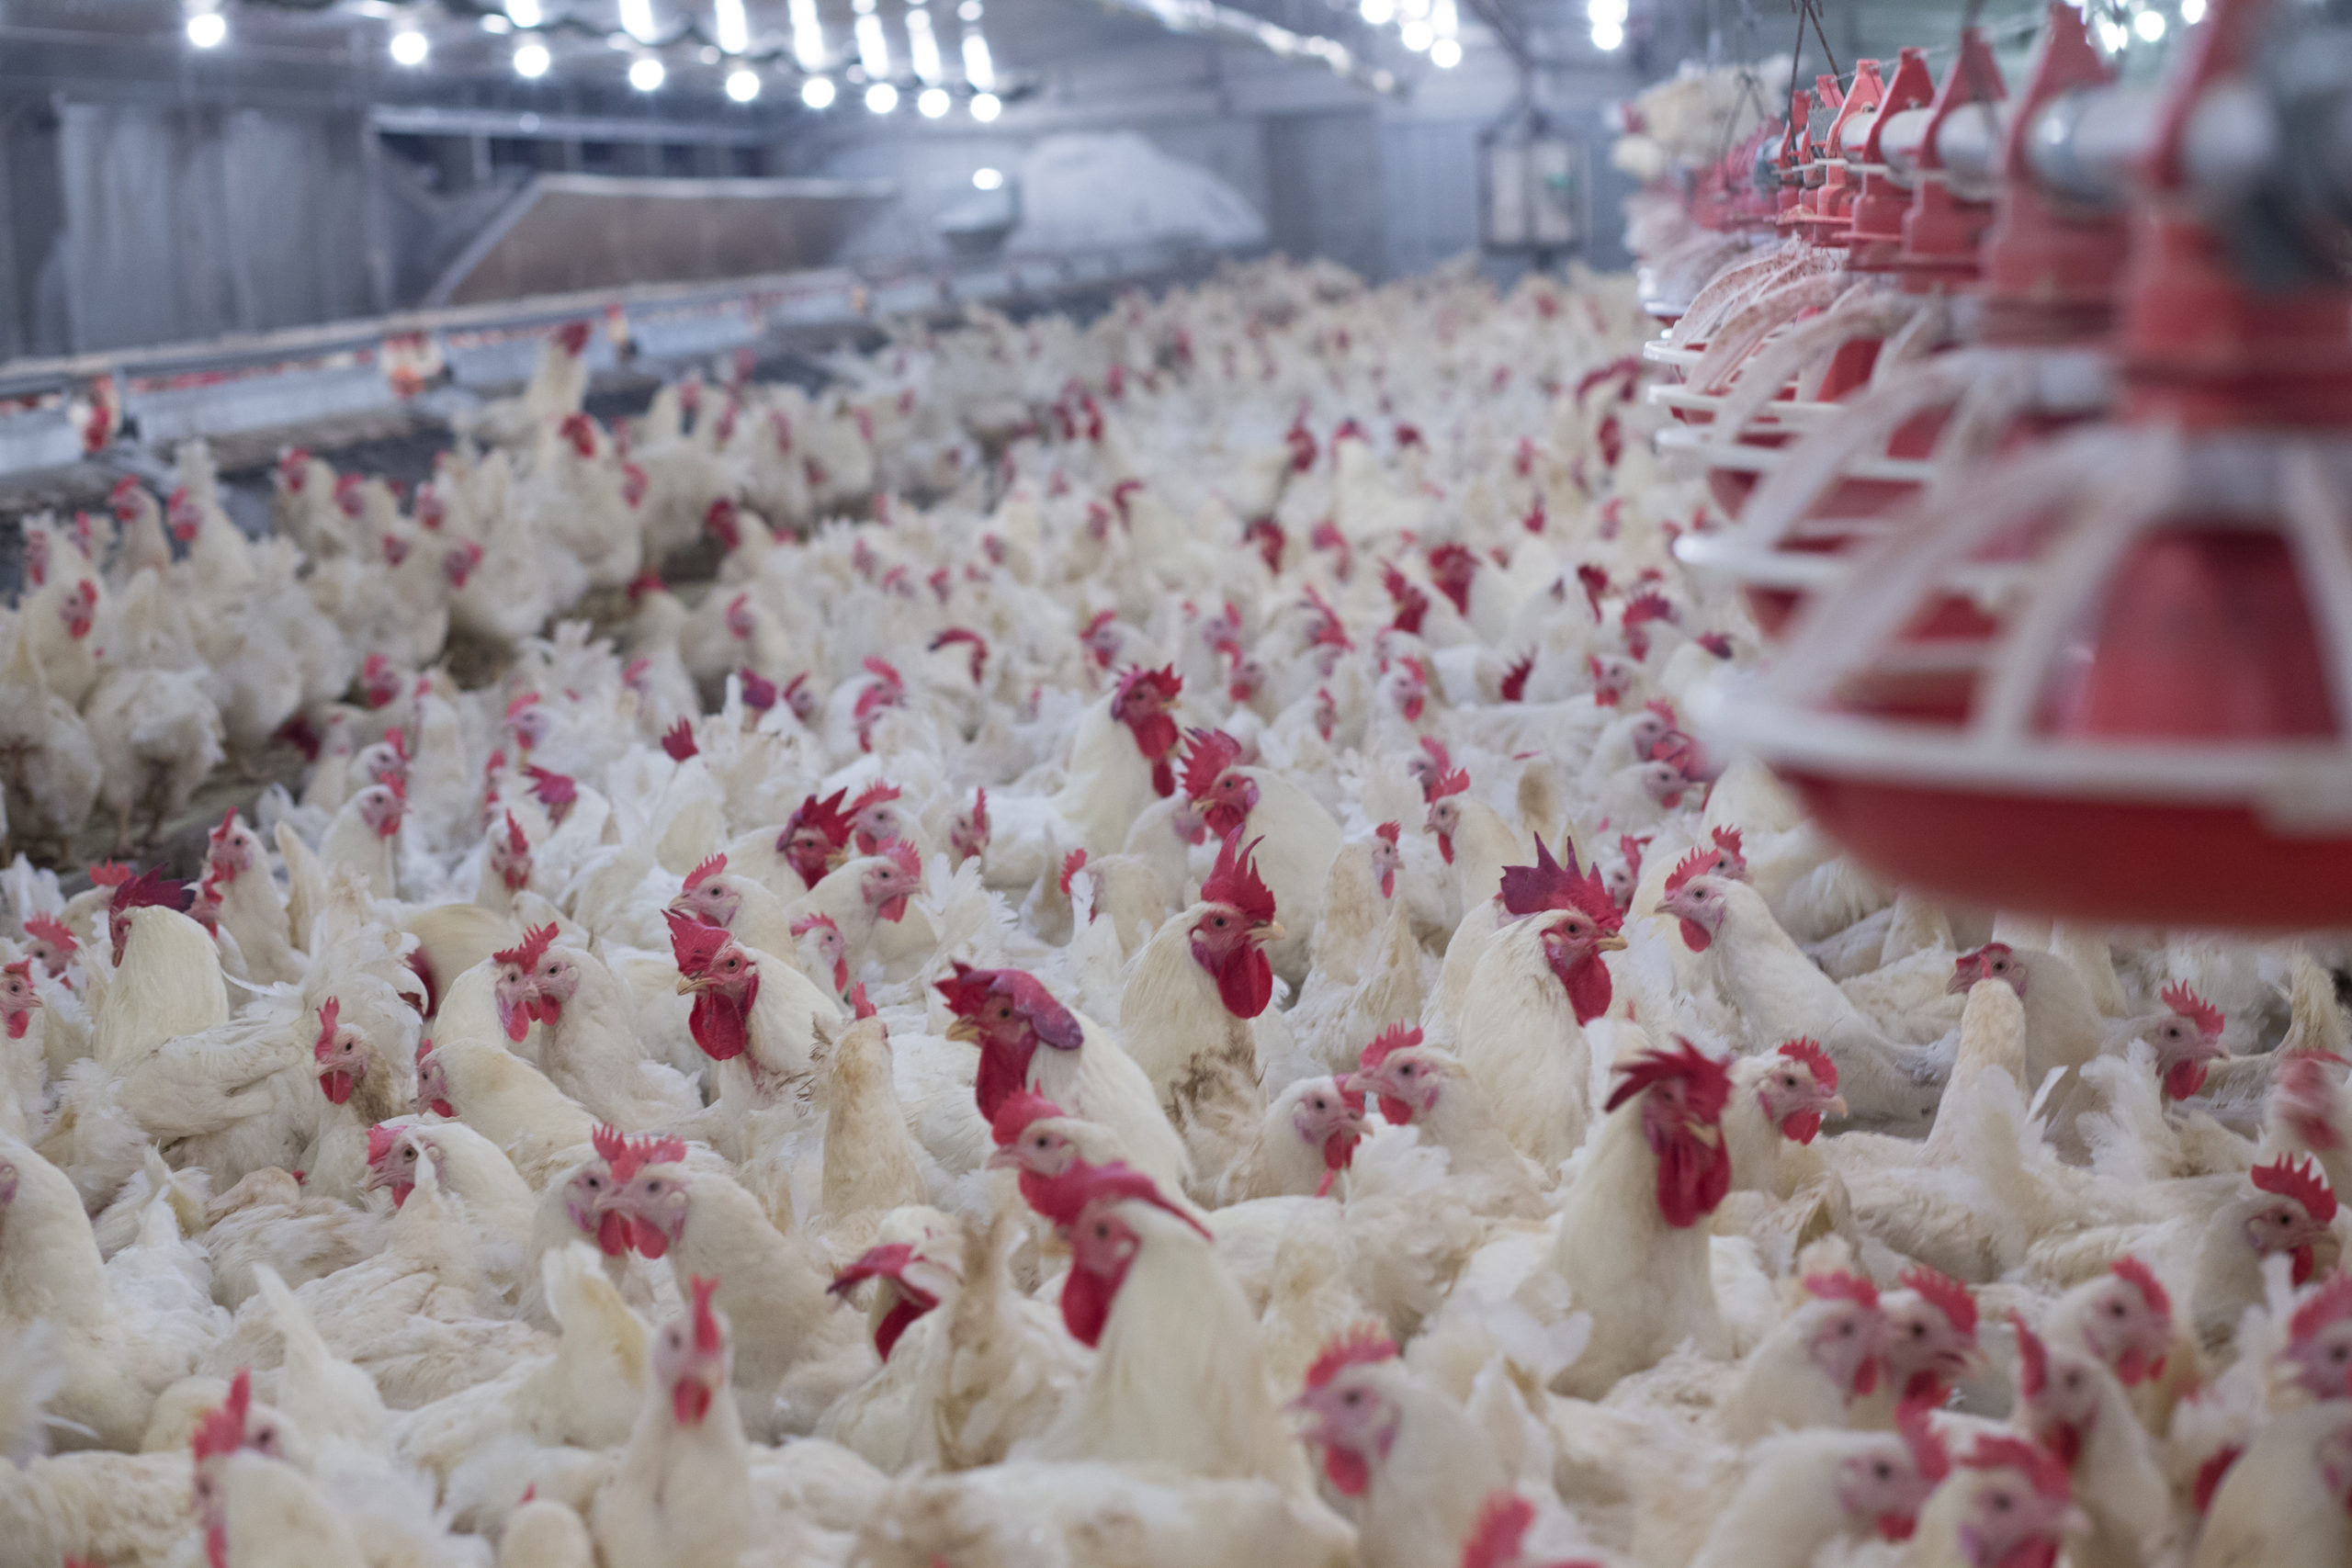
In trying to optimize, broiler meat producers can consider increasing or decreasing stocking density. One study suggested raising stocking density from 6 to 13 broilers/m² (13 to 27 kg/m²) and found lowered body weight gain but no effect overall on FCR. Also, meat quality was not affected (Simitzis et al., 2012).
To quantify the relation between zootechnical performance and stocking density under more commercial circumstances (37 to 42 kg/m²), and determine if feed additives have an influence at different stocking densities, a trial was executed by Kasetsart University in Thailand.
The trial consisted of 4 treatments, divided over 2 stocking densities (14 vs. 17 broilers/pen) either with or without a commercial feed additive (M-prove). Each treatment consisted of 6 repetitions. In total, 372 Ross male broilers were included. The trial ran for 36 days. Besides zootechnical performance, meat quality parameters were also determined.
Trial arrangement
| Group | Treatment | Starter (0-10 days) | Grower (11-24 days) | Finisher (25-36 days) | Density (b/m²) |
| T1 | Control low density (CLD) | 0 | 0 | 0 | 14 |
| T2 | Control high density (CHD) | 0 | 0 | 0 | 17 |
| T3 | M-prove low density (MPLD) | 0.12 | 0.12 | 0.07 | 14 |
| T4 | M-prove high density (MPHD) | 0.12 | 0.12 | 0.07 | 17 |
Although no statistical differences were observed, the results between stocking densities in this trial (Table 2) align with the results obtained by Abudabas et al., 2013. They clearly indicate stocking density affects the zootechnical performances of the broilers and the economics of the business. The higher stocking density reduced body weight gain by 60 g, mainly from lower feed intake. Cumulative FCR was not affected. Whether the reduced feed intake was due to limited feeder space or other types of stressors was not in the scope of this trial. Therefore, reducing stocking density can result in higher weight gain without affecting meat quality. Concerning meat quality, the results of both stocking densities were similar to the findings by Simitzis et al., 2012. On the other hand, adding the feed additive M-prove to the control feed not only enhanced zootechnical performance but also tended to improve meat texture.
Quantitative results from the trial
| Group | Day-old chick weight (g) | Body weight gain (g) | Feed intake (g) | FCR | Hardness (N) | Gumminess (N) | Chewiness (N) |
| T1 | 42.8 | 2,695.8 | 3,629.5 | 1.35 | 26.2 | 14.8 | 8.8 |
| T2 | 42.8 | 2,623.4 | 3,502.7 | 1.34 | 23.8 | 13.3 | 7.9 |
| T3 | 42.8 | 2,721.2 | 3,562.3 | 1.31 | 22.8 | 12.4 | 7.1 |
| T4 | 42.9 | 2,715.2 | 3,556.7 | 1.31 | 24.8 | 14.0 | 8.5 |
| Stocking density | Low High | 2,708.5 2,669.3 | 3,595.9 3,529.7 | 1.33 1.32 | 24.5 24.3 | 13.6 13.6 | 8.0 8.2 |
| M-prove | No Yes | 2,659.6 2,718.3 | 3,566.1 3,559.5 | 1.34 1.31 | 25.0 23.8 | 14.0 13.2 | 8.4 7.8 |
Based on the zootechnical results obtained, one can further simulate the economic benefit of a reduced stocking density on margin/broiler under different market circumstances (broiler price/kg, average feed cost). As FCR was not affected by stocking density, it is clear that higher feed prices negatively affect the broiler production cost but margin/broiler can still be improved because of increased weight gain (Table 3).
Effect of lower stocking density on margin
| Live broiler prices (€/kg) | Feed cost (€/kg) 0.275 | 0.300 | 0.325 | 0.350 |
| 0.75 | 0.0113 | 0.0096 | 0.0080 | 0.0063 |
| 0.85 | 0.0152 | 0.0135 | 0.0129 | 0.0102 |
| 0.95 | 0.0191 | 0.0174 | 0.0158 | 0.0142 |
| 1.05 | 0.0231 | 0.0214 | 0.0198 | 0.0181 |
As FCR improved when using M-prove, it is clear that under high feed prices the margin/broiler can be
maintained or can be slightly increased (Table 4).
Effect of M-prove on margin
| Live broiler prices (€/kg) | Feed cost (€/kg) 0.275 | 0.300 | 0.325 | 0.350 |
| 0.75 | 0.0334 | 0.0335 | 0.0337 | 0.0339 |
| 0.85 | 0.0393 | 0.0394 | 0.0396 | 0.0397 |
| 0.95 | 0.0451 | 0.0453 | 0.0455 | 0.0456 |
| 1.05 | 0.0510 | 0.0512 | 0.0513 | 0.0515 |
Adding M-prove to the feed helped maintain (or even increase) weight gain and feed conversion in both low and higher stocking densities as well as improve meat texture. These 2 parameters resulted in an improved margin/broiler. Research shows that stocking density influences body weight gain but has hardly any effect on cumulative FCR. Because of this, margin/broiler increases depending on live broiler prices. Hence, based on the market circumstances and other costs (depreciation, labor, energy, etc.), re-evaluating stocking density to optimize costs/kg live weight and margin/broiler is a viable option.
Your Agrimprove Expert
Do you have a question or want personalized advice? Your Agrimprove expert is willing to help. Reach out directly or request to be contacted at your convenience.
THIS MIGHT ALSO INTEREST YOU
Ready for improvement? Try one of our suggested solutions with a proven added value.


